

Compulsory education
The compulsory education in Norway is 10 years, and each year over 60,000 children start school. There is a tendency towards fewer and larger schools, although due to demographic factors, there is still a large number of small schools. As a result of the teacher-to-child ratio and increased funding, the number of children per teacher has fallen in recent years, especially in the lower year groups.
A large proportion of pupils are enrolled in out-of-school-hours care, especially in the first two years of school. High enrolment rates have resulted in increased attention around content and inclusion in out-of-school-hours care.
There has been an increase in the number of adults enrolling in primary and lower secondary education, almost all of them minority language speakers.
Pupils in compulsory education have seen their grades improve in recent years. Girls receive slightly better grades than boys after Year 10. Boys outperform girls in numeracy and English, and in autumn 2019 they performed as well as girls in the Year 5 national reading test for the first time. In the case of 15-year-olds, however, PISA 2018 shows that boys have poorer reading skills than girls.
18 per cent of pupils in compulsory education have an immigrant background, a number more than double the figure in 2004. Pupils from immigrant backgrounds generally do well in the Norwegian education system, although they receive slightly lower grades than other pupils. Many pupils who arrive in Norway near the end of compulsory education are not awarded an average point score when they complete lower secondary.
Number of pupils and schools
In the 2019-20 academic year there were 636,250 pupils enrolled in public and private primary and lower secondary schools in Norway.
The pupil numbers have remained fairly stable nationally in the past decade, but there are significant differences between countie: Pupil numbers in Oslo have increased by 23 per cent in the past ten years, in Akershus county by 12 per cent, whilst there was a decline of 15 per cent in Finnmark and 11 per cent in Nordland in the same period.
Pupil numbers will fall by 4 per cent by 2028
Changes in pupil numbers can be highly significant when local authorities are planning school structures and teacher demand. Statistics Norway expects the number of pupils of primary and lower secondary school age to fall to 613,000 by 2028, which is a drop of 4 per cent on today’s figure. From 2023 it will fall by a few thousand every year (Statistics Norway, 2016a).
According to these forecasts, Sogn og Fjordane, Finnmark and Troms counties will see the biggest drops in pupil numbers, while Vest-Agder and Akershus will see the smallest decline.
The reason why Statistics Norway is expecting a fall in numbers is that immigration levels are projected to be lower in the coming years. Birth rates have also fallen, and are expected to remain low. There will always be uncertainties surrounding such forecasts.
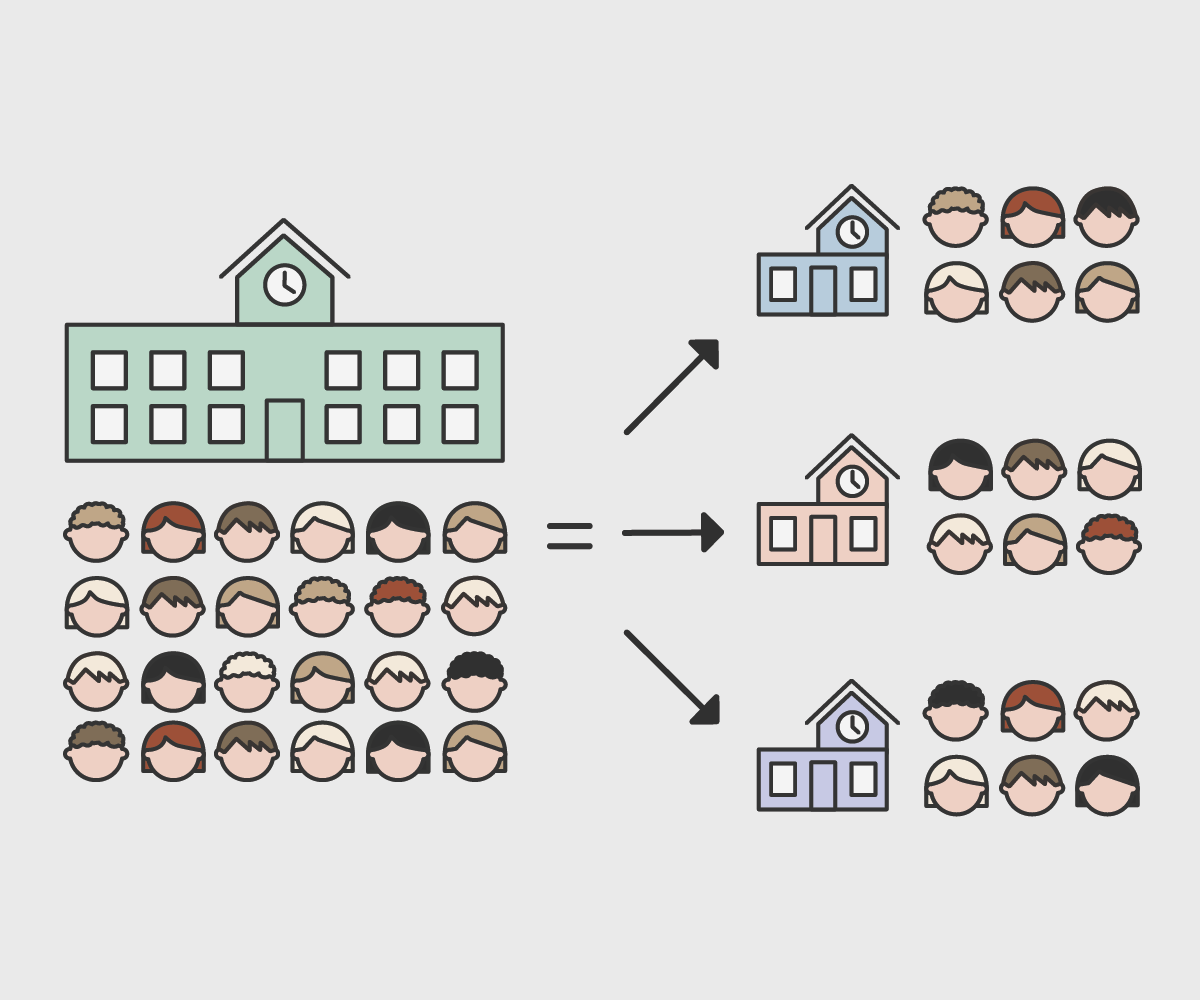
Fewer and larger primary and lower secondary schools
There are a total of 2,799 primary and lower secondary schools in Norway in the 2019-20 academic year. This number is 269 fewer than ten years ago. There is a tendency towards fewer and larger schools in Norway. In the 2019-20 academic year the average number of pupils per school was 227, which is 26 more than a decade ago. 195 schools have 500 or more pupils, which is 72 more schools than ten years ago.
While the number of very large schools is increasing, the smallest schools are dwindling in numbers. In 2009, there were 1,028 schools with fewer than 100 pupils. Today, the figure is 792. 28 per cent of schools have fewer than 100 pupils, but only 6 per cent of pupils attend the smallest schools.
School sizes vary greatly from county to county.
- In Finnmark, Nordland and Sogn og Fjordane at least half of all schools have fewer than 100 pupils.
- In Oslo 39 per cent of schools have 500 or more pupils, an increase of 26 per cent on 2009.
- None of the schools in Finnmark has more than 500 pupils.
Most schools in the northernmost counties have fewer than 100 pupils. In Oslo it is common for schools to have more than 500 pupils.
An average of 54 schools have closed down, and an average of 27 schools have opened every year since 2009-10. Most of the schools that close down are small, with an average of 69 pupils in the last year they remained open. Low pupil numbers and local authority finances may be amongst the reasons why a school shuts down.
More private primary and lower secondary schools
27,027 pupils are enrolled in private primary and lower secondary schools in Norway in the 2019-20 academic year, a total of 4 per cent of all pupils. There are 261 private primary and lower secondary schools, 99 more than in 2009-10.
Private primary and lower secondary schools are smaller on average than their public equivalents. Private schools had 104 pupils on average in 2019-20, while the average for municipal schools was 241 pupils.
In addition to private primary and lower secondary schools within Norway, there are also nine Norwegian private schools abroad with a total of 765 pupils.
Pupils enrolled in private primary and lower secondary schools 2009-2019
Only 1 in 10 public schools that close down is replaced by a private school
Many more public schools are closing down than there are new private schools opening. In only 12 per cent of cases where a public school closes down is a new private school opened in the same location in the same year. Yet 2 in 10 new private schools open in the same location as a closed down public school. Most of these are Montessori schools. 5 per cent of the public schools that shut their doors are replaced by a Montessori school in the same year.
When considering applications to set up new private schools emphasis is placed on the impact of a new independent school on the public school structure. The host municipality’s views are also taken into account.
Diversity in schools
Diversity in schools is increasing. In 2019 a total of 18 per cent of children of compulsory school age came from an immigrant background. Just over half of these children were born in Norway (Statistics Norway). This percentage has more than doubled since 2004.

Almost 1 in 5 pupils in compulsory education has an immigrant background.
6 per cent of pupils received special Norwegian language tuition in the 2018-19 academic year. The overall picture is that pupils from immigrant backgrounds are doing well in the Norwegian education system. Yet pupils from immigrant backgrounds obtain slightly lower grades in lower secondary school and are less likely to complete upper secondary.
Number of pupils with immigrant background
Pupils with an immigrant background obtain slightly lower grades than other pupils
Pupils from immigrant backgrounds – that is, pupils who have themselves immigrated to Norway or who were born here by parents who have immigrated – obtain lower average point scores than other pupils. There is a relatively big discrepancy between pupils who have themselves immigrated and pupils born in Norway to immigrant parents.
Pupils who immigrated to Norway from Africa or Asia obtain a 6.7 lower average point score than pupils from a non-immigrant background.
Average point score by immigrant category and country background 2018-19
6 percent of pupils are receiving special Norwegian language tuition
Special Norwegian language tuition is provided in the form of accelerated Norwegian language lessons. The tuition may be provided either in accordance with the Curriculum for Basic Norwegian for Language Minorities or by adapting the ordinary curriculum.
The proportion of pupils receiving special Norwegian language tuition is greatest in the early years of compulsory education. 8 per cent of pupils in Years 1–4 received special Norwegian language tuition in autumn 2018, while the figure for Years 8–10 was 5 per cent. There are considerable variations from municipality to municipality in terms of the proportion of pupils receiving special Norwegian language tuition. Amongst the biggest municipalities, Oslo has the highest percentage of pupils receiving special Norwegian language tuition at 20 per cent. The figure in Drammen is also high at 13 per cent.
The right to special language tuition
Pupils with a mother tongue other than Norwegian or Sami are entitled to special Norwegian tuition until such time as they are sufficiently fluent in Norwegian to be able to follow ordinary tuition.
7 per cent of pupils receive special Norwegian language tuition.
There are considerable variations from municipality to municipality in terms of the proportion of pupils receiving special Norwegian language tuition. Amongst the biggest municipalities, Oslo has the highest percentage of pupils receiving special Norwegian language tuition at 20 per cent. The figure in Drammen is also high at 13 per cent.
Pupils receiving special Norwegian tuition and other special language tuition
Sources
Caspersen, J., Buland, S, Valenta, M. & Tøssebro, J. (2019). Inkludering på alvor? Delrapport 1 fra evalueringen av modellutprøvingen Inkludering på alvor. Trondheim: NTNU.
OECD. (2019). Trends Shaping Education 2019. Paris: OECD Publishing.
Statistisk sentralbyrå. (2019). Nasjonale prøver: Foreldrenes utdanning spiller stor rolle. Oslo: Statistisk sentralbyrå.
Rogde, K., Federici, R. A., Vaagland, K & Wollscheid, S. (2018). Spørsmål til skole-Norge. Analyser og resultater fra Utdanningsdirektoratets spørreundersøkelse til skoler og skoleeiere høsten 2018. NIFU Rapport 2018:34.
Wendelborg, C.(2019). Analyser av indekser på Skoleporten 2018: Analyser på fylkes- og nasjonalt nivå for 7. trinn, 10. trinn og Vg1. Trondheim: NTNU Samfunnsforskning.
Ekspertgruppa om lærerrollen. (2016). Om Lærerrollen. Et kunnskapsgrunnlag. Oslo: Fagbokforlaget.
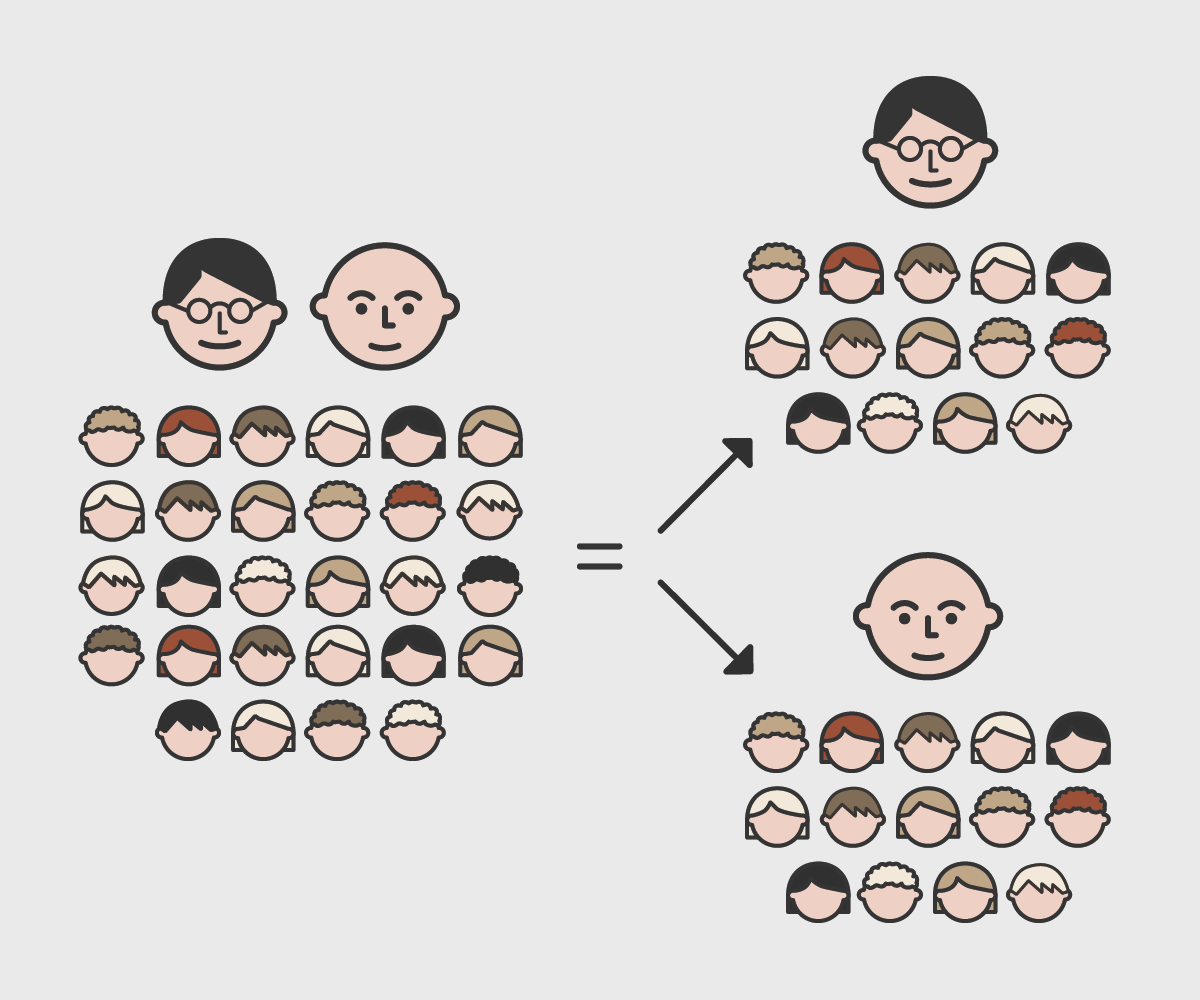
Pupil-to-teacher ratios and required qualifications
Almost 70,000 teachers are currently working in Norway. They are teaching 636,250 primary and lower secondary pupils. The main duties of a teacher are to plan, deliver and assess the pupils’ learning and to adapt the tuition to each pupil and the class as a whole. The social mandate given to teachers is to promote pupils’ learning and development (The expert panel on the role of the teacher, 2016).

In the 2019-20 academic year there are 14.0 pupils per teacher in Years 1–4.
New regulations and earmarked funding has increased teacher density
In the autumn of 2019 there were more than 40,300 full time employees (FTEs) dedicated to mainstream teaching in public schools. There has been an increase of 3,175 FTEs allocated to mainstream teaching since 2014 as a result of funding being earmarked for training more teachers in the past five years. The increase in teacher FTEs has resulted in an increase in the teacher density, and there are now 15.9 pupils per teacher in Years 1–10 overall. This is a clear improvement in teacher density compared with the past ten years. The improvement is particularly evident in Years 1–4, where the pupil-to-teacher ratio went from 16.2 to 14.0 pupils per teacher between 2014-15 and 2019-20.
Pupils per teacher in mainstream classes by year (public schools)
The proportion of primary and lower secondary schools that meet the statutory requirement is lowest in Years 1–4 at 81 per cent. However, it is also Years 1–4 that have seen the greatest increase – 5 percentage points since 2018 – in the number of schools satisfying the requirement. Many schools only lack 0.5 FTE in order to achieve the statutory ratio.
Proportion of schools that achieve the statutory pupil-to-teacher ratio 2019-20, by level
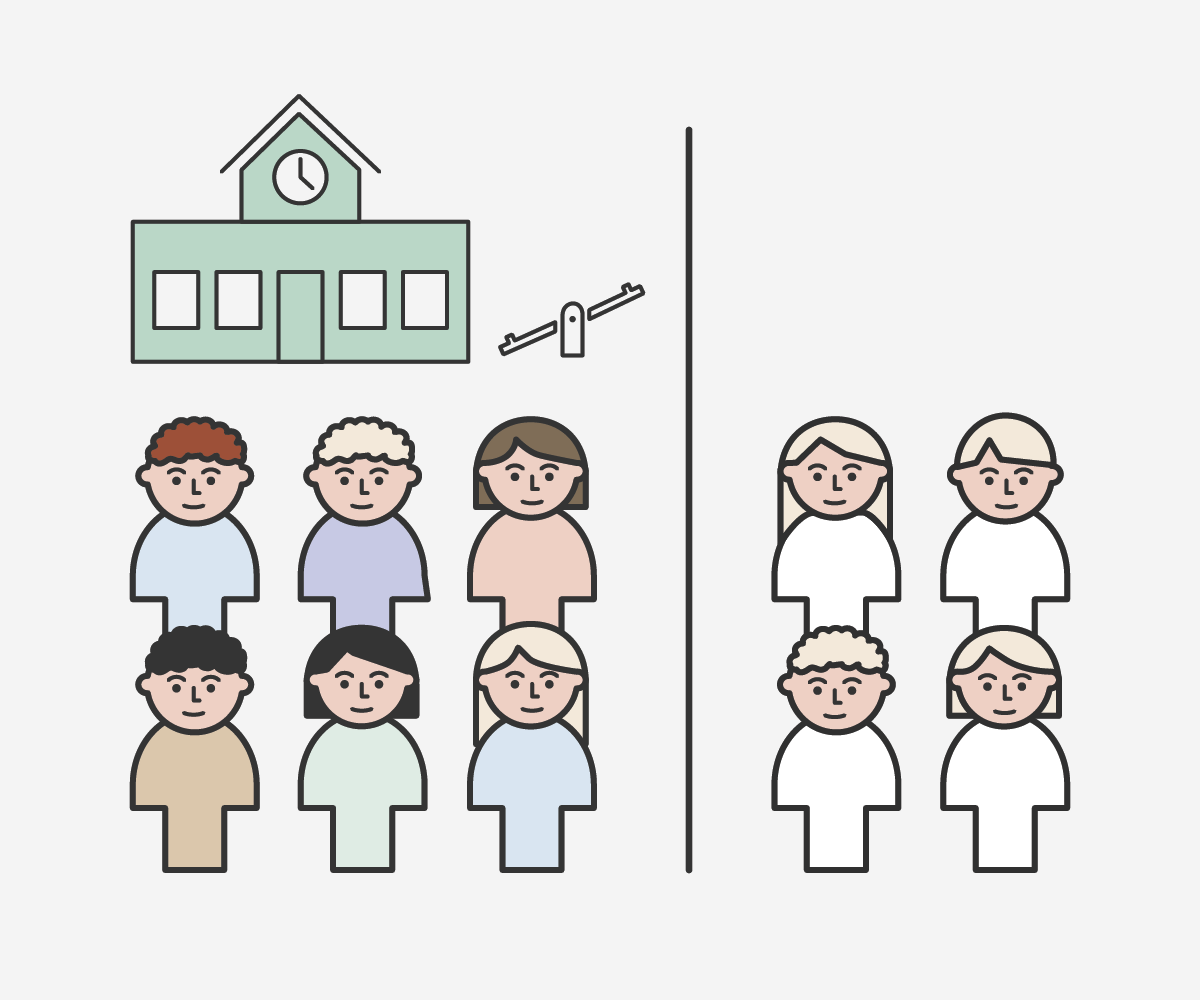
Two teachers per class is more common than multiple classes per year group
8 in 10 school leaders who have received funding to reduce the pupil-to-teacher ratio say that the additional resources are primarily being used to introduce a second teacher to existing classes. Just over 4 in 10 also say that the teachers are used for intensive courses in Years 1–4 (Rogde et al., 2018).
School buildings and educational considerations may play a role when deciding whether to divide classes or deploy additional teaching resources to existing classes when such resources are made available.
Most schools assign two teachers to a class rather than create smaller classes.
Correlations between pupil-to-teacher ratio and pupil performance are difficult to identify
Although research does exist on the causal effect of lower pupil-to-teacher ratios on pupil performance, there is little consensus between the researchers. The results vary depending on year group, class, country and differences in class sizes. Several large research projects are underway to investigate these correlations further.
Many teachers do not hold the required qualifications to teach certain subjects
To gain permanent employment as a teacher in compulsory education, applicants must hold a teaching qualification or other approved qualification. 5.7 per cent of teachers do not meet this requirement.
They must also have obtained a certain number of ECTS credits in order to teach certain subjects.
Many of the teachers with an approved teaching qualification do not meet the qualifications requirement in the subjects they teach. The percentage is highest in English, where 39 per cent of teachers do not meet the qualifications requirement. In mathematics the figure is 27 per cent, while it is lowest in Norwegian at 19 per cent.
The percentage of teachers who fail to meet the qualifications requirement is especially high in English in Years 1–7. 40 per cent of these teachers do not have the required ECTS credits.
If all of the teachers who do not meet the qualifications requirement for teaching Norwegian, mathematics and English were to enrol in continuing education, it would require 22,581 places to be created for them. There has been a steady fall in the proportion of teachers who do not meet the qualifications requirement since 2015-16. The biggest drop has been at the lower secondary stage.
Qualification requirements
Teachers of Norwegian, mathematics, English, Sami and Norwegian Sign Language must have obtained 30 ECTS credits to teach at the primary stage and 60 credits to teach at the lower secondary stage. Those who graduated before 1 January 2014 have dispensation from these requirements until 1 August 2025.
Proportion of teachers who do not meet the qualifications requirement by level and subject 2019-20
Out-of-school-hours care
The local authority must provide out-of-school-hours care (known as SFO) before and after ordinary school hours for pupils in Years 1–4 and for pupils with special needs in Years 1–7. The arrangements should include care and supervision and offer the children opportunities for play, cultural and leisure activities.
Many pupils attend SFO, especially in the lower year groups
6 in 10 children in Years 1–4 attend SFO. Just over half of the children who attend SFO have been given a full-time place. SFO participation in Years 1–4 has been fairly stable in the past ten years. The older the children, the less likely they are to sign up for SFO. 82 per cent of Year 1 pupils attend SFO, while in Year 4 the figure is 31 per cent.
6 in 10 children in Years 1–4 attend SFO.
SFO participation varies between counties and municipalities. In Oslo 87 per cent of pupils in Years 1–4 have signed up, while the lowest participation rate is found in Nordland at 47 per cent.
Proportion of children attending SFO by year, 2019-20
Few national guidelines
There are few national guidelines in place for SFO, and the scope for local input is great. This results in considerable variations in terms of design and staffing levels, content and objectives.
An evaluation of the SFO scheme has found that local authorities and SFO workers place varying degrees of emphasis on play and learning (NTNU, 2018). The scheme is referred to as SFO in most municipalities, while in Oslo and Drammen it is known as Activity School (Aktivitetsskolen). The different designations reflect different approaches to content and structure, although an evaluation of the SFO scheme has found that the content can be the same in practice (NTNU, 2018).
Parents are largely satisfied with out-of-school-hours care
90 per cent of parents say their children enjoy going to SFO, and almost as many (88 per cent) agree that they have a good relationship with the SFO workers, according to figures from the Parent Survey (Wendelborg, 2019).
Large variations in the cost of an SFO place
The cost of attending SFO is determined locally. The cost of a full-time place varies from NOK 0 to more than NOK 3,000. Around 4 in 10 schools offer discounts with income-based rates and/or free places. While 1,473 schools offer a sibling discount, 691 schools say they do not.
SFO may charge for voluntary organised activities such as ski or chess instruction, for example. Many schools are working with voluntary organisations to create SFO content. The autumn of 2020 will see the introduction of a nationwide scheme for means-tested parent contributions.
Lower cost means higher participation rates
The higher the participation rate, the more important SFO becomes from an inclusion perspective. An evaluation has found that SFO is not widely used as a means of and arena for including minority language children (Caspersen et al., 2019).
Free part-time places or reduced parent contributions are used by several local authorities to make SFO available to more children. Drammen municipality offers free SFO places in the afternoons for all children from low income families, while Oslo offers free part-time places to all Year 1 pupils. Some Oslo schools also offer places to other year groups. Participation has increased in schools that offer free SFO, something which indicates that cost has an impact on attendance. 76 per cent of pupils in Years 1–4 in Oslo attended SFO in autumn 2015. By autumn 2019 the figure had increased to 89 per cent. At Furuset school attendance rates in Year 1 increased from 33 per cent in autumn 2015 to 93 per cent in autumn 2019.
Local discount schemes and free part-time places may be the two most important means of giving more children the opportunity to attend SFO, and they can help provide access to many children who would otherwise not have benefited from the provision.
Adult basic education
There are almost 14,000 adults in primary and lower secondary education in the 2019-20 academic year. This group includes both adults receiving mainstream primary or lower secondary education and adults receiving special needs support. 98 per cent of participants in mainstream primary or lower secondary education for adults are minority language speakers.
Adults in mainstream and special needs education
Learning outcomes
A number of sources provide information about learning outcomes. The most important are national tests, exam results, coursework grades and international studies.
Improved grades in lower secondary
The Year 10 cohort of 2018-19 achieved an average point score of 42. This is 0.2 points higher than the previous year. The average point score has increased gradually over time. The increase has been slightly bigger for girls than for boys, and girls now obtain 4.6 points more than boys on average. The introduction of assessments in optional subjects helped raise the average point score since the average score in optional subjects is higher than in other subjects.
The increase in average point scores alone cannot be used to determine whether pupils are performing better. Trends in national tests primarily show little change over time, although there are signs that the percentage of pupils performing at the lowest proficiency levels is falling. However, the national tests measure far fewer competence aims than does the average point score, the latter representing the pupil’s overall attainment level upon completing compulsory education.
There was a 2.9 point discrepancy between the counties with the highest and the lowest average point scores in 2018-19. Oslo saw the biggest average increase and had the highest average in the 2018-19 academic year with 43.3 points.
3,300 pupils have not obtained grades in more than half of their subjects and are therefore not given an average point score. This is equivalent to 5.3 per cent of all pupils.
Stable results in Year 5
In the autumn of 2019 a total of 60,000 Year 5 pupils sat the national tests in reading, numeracy and English.
In reading the percentages of pupils performing at the highest proficiency level (level 3) and at the lowest level (level 1) both fell slightly compared with 2016. The result is that the proportion of pupils performing at the middle level has increased by 4.9 percentage points.
Year 5 pupils by proficiency level in reading 2016-2019
Boys are catching up with girls in reading
Girls have outperformed boys by one or two scale points in reading since 2016. However, in autumn 2019 girls and boys performed at the same level in the reading test. In numeracy and English the difference between the genders remained the same as in 2018. On average, boys score two scale points higher than girls in numeracy and one scale point higher than girls in English.
Average score in national tests in Year 5 autumn 2019.
Compared with 2018, the proportion of girls performing at the lowest proficiency level in reading increased by 2.4 percentage points, while the proportion of boys performing at the lowest level fell by 2.7 percentage points. The proportion of girls performing at the highest level fell by 3.3 percentage points in the same period.

In Year 5 boys performed slightly better than girls in English and numeracy and at the same level as girls in reading.
The biggest difference between girls and boys can be found at the highest proficiency level in reading. 29.6 per cent of boys performed at the highest level. For girls the figure was 21.1 per cent.
Few changes in national test results in Years 8 and 9
There were no changes in average scale points in reading and numeracy in Years 8 and 9. In reading the proportion of pupils performing at the two lowest levels fell from 28 to 25 per cent in the period 2016 to 2019.
In English the proportion of pupils at the two lowest proficiency levels decreased from 28 per cent in 2014 to 26 per cent in 2019.
PISA shows a decline in Norwegian pupils’ reading performance
PISA 2018 reveals a pronounced decline in Norwegian pupils’ reading performance since 2015 to levels seen in previous PISA surveys. The results in mathematics are the same as in 2015, while in science there was a slight drop. Norwegian pupils are still performing at or above the OECD average in all three subject areas.
PISA shows that 15-year-old boys have significantly poorer reading skills than their female peers
For the first time Norwegian girls are performing significantly better than boys in all of the three subject areas – reading, mathematics and science. The gender differences are considerable in reading but minor in science and mathematics. In reading there are more boys than girls performing at a low proficiency level, and there are fewer boys than girls performing at a high level.
Norwegian PISA results 2000 to 2018
Changing reading habits
PISA 2018 also asked the pupils about their reading habits. More than half of all pupils (51 per cent) say they do not read in their spare time. In 2009 the figure was 40 per cent. The amount of time pupils spend in front of their screens is increasing, meanwhile. Changes in Norwegian pupils’ reading habits are in line with the trends in other countries, but more Norwegian pupils than the OECD average say they only read when they have to.
The pupils’ backgrounds mean less in Norway than in most other countries
In Norway there is less of a link between the pupils’ home background and school performance than in most other countries. There is also little variation between schools compared with other countries. This suggests that Norwegian schools are broadly able to offer an equitable education to pupils from different backgrounds and that the vast majority of schools have pupils performing at different proficiency levels.
What is PISA?
PISA measures 15-year-olds’ abilities in reading, mathematics and science.
The survey also provides information about other factors such as learning environment and the impact of the pupils’ home background on the results.
The survey is conducted every three years. All three subject areas are included in every survey, but the main subject area alternates from survey to survey. The main subject area is subject to additional academic tests and questions. Reading is the main subject area in PISA 2018.
The survey is anonymous and based on a random selection of pupils. This means that PISA can provide information about Norwegian pupils generally but not about individual schools or pupils.
In 2018 around 600,000 15-year-olds from 79 countries participated in the survey. Some 5,800 15-year-olds from 250 Norwegian schools took part.
The Norwegian Directorate for Education and Training has delegated responsibility for the practical organisation of the PISA study in Norway to the Department of Teacher Education and School Research at the University of Oslo
OECD oversees the PISA survey internationally.